|


Statistics and analysis of newsletter campaignsThere are many powerful functions for statistics and analysis of newsletter campaigns (e-mail campaigns) included in the newsletter software SamLogic MultiMailer. With these functions you can for example see the following: l how many contacts that have opened your newsletter l how many contacts that have clicked on a link in your newsletter l who of your contacts that have opened your newsletter l who of your contacts that have clicked in links in the newsletter and which links they have clicked on l compare newsletter campaigns with each other and see what the trend is 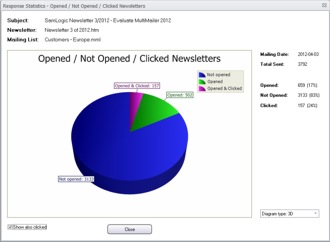 How
many contacts have opened your newsletter? How
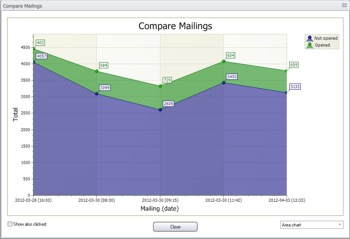
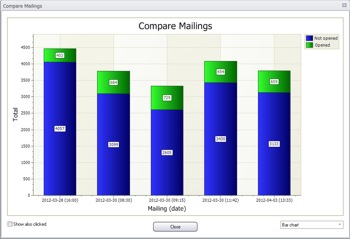
many contacts have opened your newsletter?Maybe you have designed a beautiful newsletter and have a mailing list with a huge number of contacts, and you send a newsletter to them regularly. But how many of them are actually opening your newsletter? And how many of them click on links in the newsletter? With the statistics and analysis functions in MultiMailer you can find out this in an easy way. You can view the information graphically in a chart or view the information in a detailed table with all necessary facts. The information can also be exported to other programs, for further analysis. The picture to the right shows a pie chart with information about the number of opened and not opened newsletters. The chart also shows information about the number of contacts that clicked on links in the newsletter. Click on the picture to view it in a larger size. Who of your contacts have opened your newsletter? With MultiMailer you can also see who of your contacts that opens a newsletter that you send out. The contacts that have opened your newsletter will be marked with a special symbol (  Who of your contacts have clicked on links in the newsletter? One of the most useful functions in MultiMailer is the possibility to see who of your contacts that have clicked on links in your newsletter and which links they have clicked on. In this way you can see what information and products that your contacts are actually interested in, and you can do a follow-up (for example by e-mail or phone) that is really efficient. Contacts that have clicked on links in a newsletter will be marked with the special symbol Comparison of newsletter campaigns - what is the trend? In MultiMailer you can compare different newsletter campaigns (e-mail campaigns) with each other and see what the trend is. You can for example see if the number of active subscribers increase or decrease over time, and if the open rate or click rate increase or decrease over time. If you, for example, want to find out which subject line that gives the highest open rate you have the necessary tools to measure it in MultiMailer. By looking at trends, it is easy to see exactly what is and isn't working in the emails you send. By comparing stats like opens, clicks, unsubscribe requests etc., you can quickly see what content your subscribers find relevant, and just as importantly, what they don't.
|